Today a reader, tomorrow a leader.
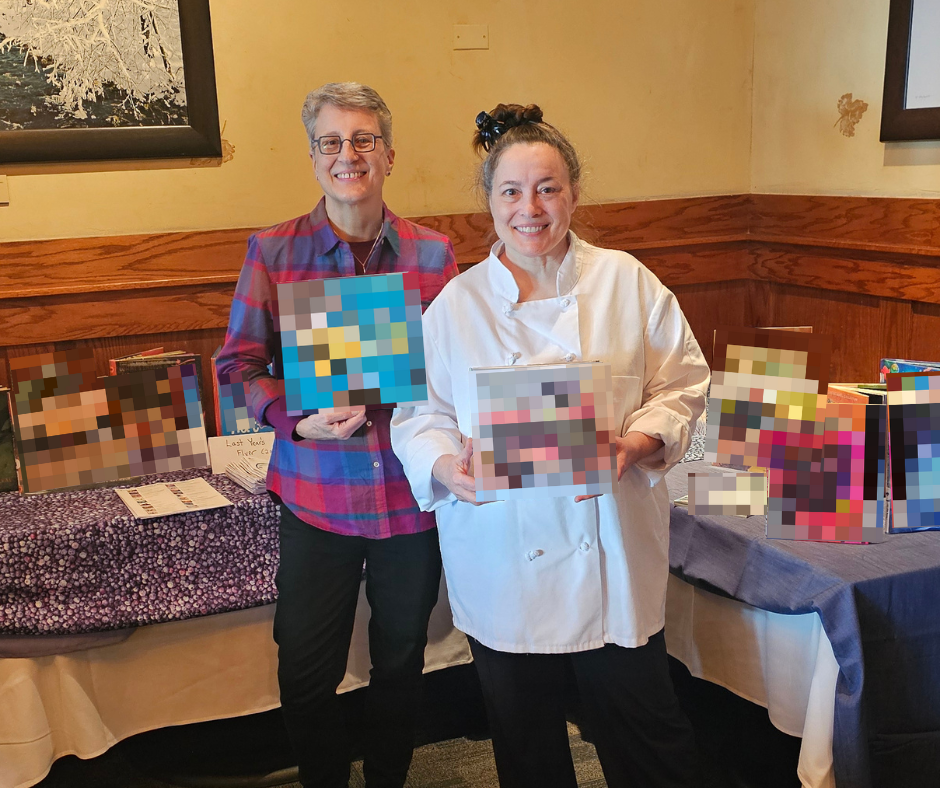
Support the LibraryA sneak peek of the 3rd Annual Blueberry Award winners
March 5, 2024
Why would one relatively small, suburban library launch its own national children’s book award full of bugs, trees, and climate heroes? “The American Library Association does not have an award that’s specifically for nature and climate books,” said Evanston Public Library Children’s Library Assistant Martha Meyer, the force behind the Blueberry Awards, at a special […]
Read More